[ 2015-April-02 09:44 ]
I secretly love debugging. I hate the fact that it sometimes feels like you don't make progress, but figuring out a bug is so satisfying. I sometimes call debugging the fundamental skill of programming, because you need to debug to do anything else, such as teaching yourself new programming languges or understanding how to get a command line tool to do what you want. This is the story of how I figured out that JVM statistics can cause garbage collection pauses, which I hope is an interesting case study in how to debug hard problems. TL;DR: I noticed the problem was common on a system with a magnetic disk, but rare on a system with a flash disk. My process didn't do any file I/O, so inspecting the JVM showed the only writable file it had was the hsperfdata statistics file.
The full story
Around November of last year, a service I help maintain at Twitter had one or two instances a day garbage collect for 6-7 seconds, while normal pauses rarely take more than 100 milliseconds. This was a standard garbage collection issue that was resolved with some GC flag tuning [1]. To make sure the problem was fixed, I periodically looked at the chart of garbage collection pause times across all instances. After a few days, I didn't see any six second pauses. However, I did see something unusual:
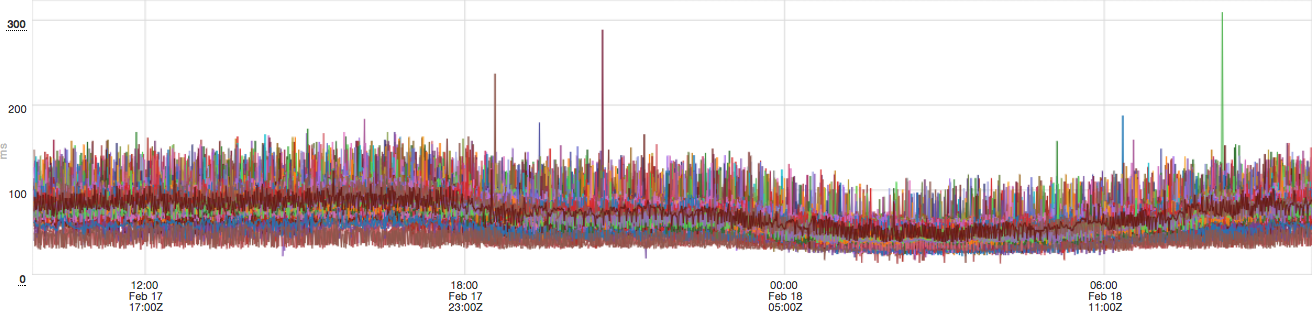
This figure shows that most pauses are below 150 milliseconds, but a few instances a day have pauses greater than 200 milliseconds, and sometimes as high as 500-700 ms. When I looked at the garbage collection logs, I noticed these pauses were typical "ParNew" collections, so this must be a different problem. As I always do with garbage collection mysteries, I asked Carsten Varming, Twitter New York's JVM developer, for help. He noticed the log showed that the real time of the pause was longer than the sum of user and system CPU time. A parallel collection runs with multiple threads, so the user CPU time is typically many times larger than the real time. This means the kernel was suspending the GC threads for some reason. Carsten also suggested monitoring the safe point times, rather than just garbage collection pauses, since it may be affecting them as well.
Pauses everywhere
In the grand scheme of things, these pauses were not very important. For this service the worst-case impact on users was infintesimally small, maybe hundreds of timed out requests a day. However, at apporximately the same time we were deploying a new latency-sensitive service. I was looking at garbage collection times after a load test, and low and behold: this unrelated service had the same suspicious pauses. I started checking other services, and I ended up finding these pauses in nearly every service, as long as they were running a moderate number of instances. What could possibly be causing pauses that are hundreds of milliseconds long, in every service at Twitter?
At this point, I became slightly obsessed. More than anything, I justed wanted to understand what was happening, since it didn't make any sense. It also changed the value of understanding the problem. Instead of fixing some tiny GC blips in one service, I might be able to fix GC blips across all of Twitter's services, which might actually be worth my time (or at least that is how I justified it). I began to spend an hour or two looking at random logs and charts, every time I noticed a GC pause that looked suspicious (a few times a week), hoping to find some correlation. I also asking others for their theories, each time I found some interesting new data. Finally, I also started searching for reports of similar problems.
Other competing processes
One theory was that these systems were simply busy, so the kernel ran some other task while the JVM was garbage collecting. At Twitter, we use Apache Aurora to run services in our data centers. Aurora is built on Mesos, whichs relies on Linux containers (cgroups) to prevent processes from consuming more CPU and memory than they were allocated. I verified that we don't allocate more CPU than we actually have, and that even in the worst case other services should only be able to steal the CPUs for tens of milliseconds, not hundreds of milliseconds. It could still be possible for processes that are running outside the containers to cause this. I spent a lot of time digging through log files to try and find some tasks that might be running while these suspicious pauses occurred. I did find one or two instances where an expensive task seemed to be running at approximately the right time, but never anything that could explain all the pauses.
Investigating this theory was mostly a waste of time. I did learn about a number of system management and monitoring tasks that we run, but otherwise this was a complete waste of time.
Safepoints: Possibly affected?
Garbage collection is the most well known reason the JVM pauses an application, but there are many others, such as re-compiling a method. Thanks to Carsten's suggestion, I started looking at safepoint logs and noticed that on instance that have suspicious garbage collection pauses, there were usually safepoint pauses that also took hundreds of milliseconds, with no clear pattern or cause. Unfortunately, the JVM does not record the real/user/system times for safepoints, so while I suspected that these pauses were related, but wasn't 100% sure.
Related problems
The Internet contains many discussions about interactions between the JVM and the Linux kernel, like "page scan attacks", zone reclaim, transparent huge page compaction and splitting, and that writes to cached files can block. I was very excited after I read about blocking cached writes. If GC threads write to a log using the write system call, that could occasionally block for hundreds of milliseconds. This would cause the garbage collection to take a long time, but have low user and system time since the process is not running. A brief look at the Open JDK code seemed to suggest that garbage collection logs are written by the GC threads, themselves. I wrote a small C program and was able to reproduce pauses on a clean virtual machine. However, when I asked Carsten about it, he told me that Twitter's JDK has a custom logging patch that writes to a circular buffer, and does the writes on an unrelated background thread. This means this couldn't be our problem (but I would love to hear if this can happen with OpenJDK!).
A critical correlation
One day I noticed an instance of a service that had these pauses far more frequently than others: many times each day. I decided to graph nearly every system-level statistic I could, since I figured there must be something different about this system or process. After an hour or two, I finally saw a suspicious correlation with the "milliseconds spent writing" exported by /proc/diskstats on Linux, and displayed with vmstat -D:
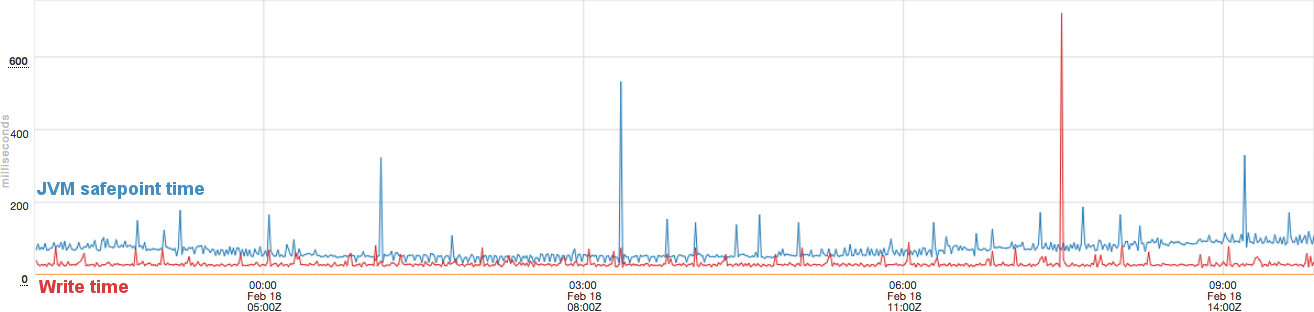
This shows that in many cases when the write time (red line) spikes, the safepoint time also spikes. It is not a complete match, but it was far more suggestive than any of the others I had looked at. I then decided to look for an instance that did not have these frequent pauses, so see what this statistic looked like there. I quickly found one that seemed to never have pauses in the past week. When I looked at its write time, I discovered that even the average write time was significantly lower: rather than ~10-30 ms (as shown above), this instance's time was less than 5 ms. This made me realize that something must be different about the hardware of these instances, which led to a critical discovery: the problematic instance had a mechanical hard drive for its boot disk, while the "no pause" instance had an SSD.
How can disk I/O cause long GC pauses?
This suggested these pauses were somehow connected to disk I/O. I validated this hypothesis on a few more instances. I could predict if the machine had a magnetic disk or an SSD by looking at its safepoint time history: no pauses? SSD. Pauses? magnetic disk. So how could slow disk writes cause safepoints to take a long time? This had me stumped: this service doesn't write to disk at all, so how could it possibly be affected? I used lsof to look for all files opened by the process, to see if it could possibly be writing to anything. I found one that I didn't know anything about: /tmp/hsperfdata_(user)/(pid). A bit of searching revealed this file is used to export some of the JVM's statistics, by using an mmap-ed writable file. Finally, I had a good hypothesis: If writes to a cached file can block, can writes to an mmaped writable file block as well?
I wrote a test program and ran it on a new VM on Google Cloud, with a version of Linux as close to Twitter's internal distribution as I could find. Sure enough, if you run it for a while on a system that is doing significant I/O, you rarely get pauses that are hundreds of milliseconds long. The rest of the details are explained in my other blog post.
How to debug hard problems
The best guide on debugging I've seen is the book Debugging by David Agans (web site). This experience re-enforces many of Agans's principles:
- Quit thinking and look: I eventually found the problem by looking at "random" statistics, just hoping to find a correlation. I did not find it through intelligent reasoning.
- Make it fail: The instance that had the problem more often was a key discovery. Creating a minimal test that reproduced the problem was the next step, and necessary to confirm the problem and the fix.
- Understand the system: I gained a significantly better understanding of garbage collection and the kernel's memory management system by researching and experimenting with incorrect theories. I needed to understand both to connect disk I/O latency to the statistics file.
I would add one other point: be patient. It took me four months to figure this out. I wasn't sure if I ever would, but I kept looking.
Thanks!
A number of people at Twitter helped me figure this out. I especially need to thank Carsten Varming, who has explained JVM garbage collection to me about six times, and will probably have to do it again in another month or two. I also need to thank Adam Crane, who provided ideas for things to look at. I'm probably forgetting someone, but also thank you to: Tony Printezis, Ramki Ramakrishna, Boaz Avital, Peter Beaman, Kaushik Srenevasan.
Footnote: [1] Original GC issue
The Concurrent Mark and Sweep (CMS) collector can have a "promotion failure" when there is no free chunk of memory big enough for an object that needs to be allocated. It falls back to a single-threaded compacting collector in this case, which consolidates all free space into a single contiguous chunk (see Java Garbage Collection Distilled). Since it only uses a single thread and touches the entire heap, this easily takes multiple seconds. (back to the reference to [1])