[ 2019-November-19 08:44 ]
(I gave this talk at Google Cloud Next 2019, then wrote this post for the Bluecore Engineering blog.) Bluecore runs its software in the cloud, where we are charged for the amount of resources we consume (e.g. gigabyte-hours of RAM, core-hours of CPU, etc). We receive a detailed daily bill, showing how much of each resource has been used. Our bill has grown with our business to the point where two years ago we wanted to reduce our cost. But how? Despite the detailed bill, it was still mysterious where the money was going. Bluecore is a multi-tenant application, so we run one large instance for multiple customers. This means we have some large line items on our bill.
If you can run your software in different projects/accounts (e.g. a project per feature or a project per customer), then the bill provided by your cloud provider will directly be useful. However, this only works for one dimension, and at Bluecore we need two: cost per feature and cost per customer. The cost per feature allows us to understand the cost per team. We serve some of the world’s largest retailers, so we need the cost per customer because our largest customers use two orders of magnitude more resources than our smallest. We had to figure out how to get more details. Our approach was:
- Put the data in one database (BigQuery)
- Combine billing data with other usage data
- Instrument the code where we need more detail
In this post, I’ll explain how we instrumented our application to break down our cloud bill by engineering team and customer. This allows us to forecast resources per customer, find cost bugs, and efficiently prioritize work. (If you prefer, you can watch my Google Cloud Next 2019 talk or browse the slides, which this post is based on.)
Put the bill in a database
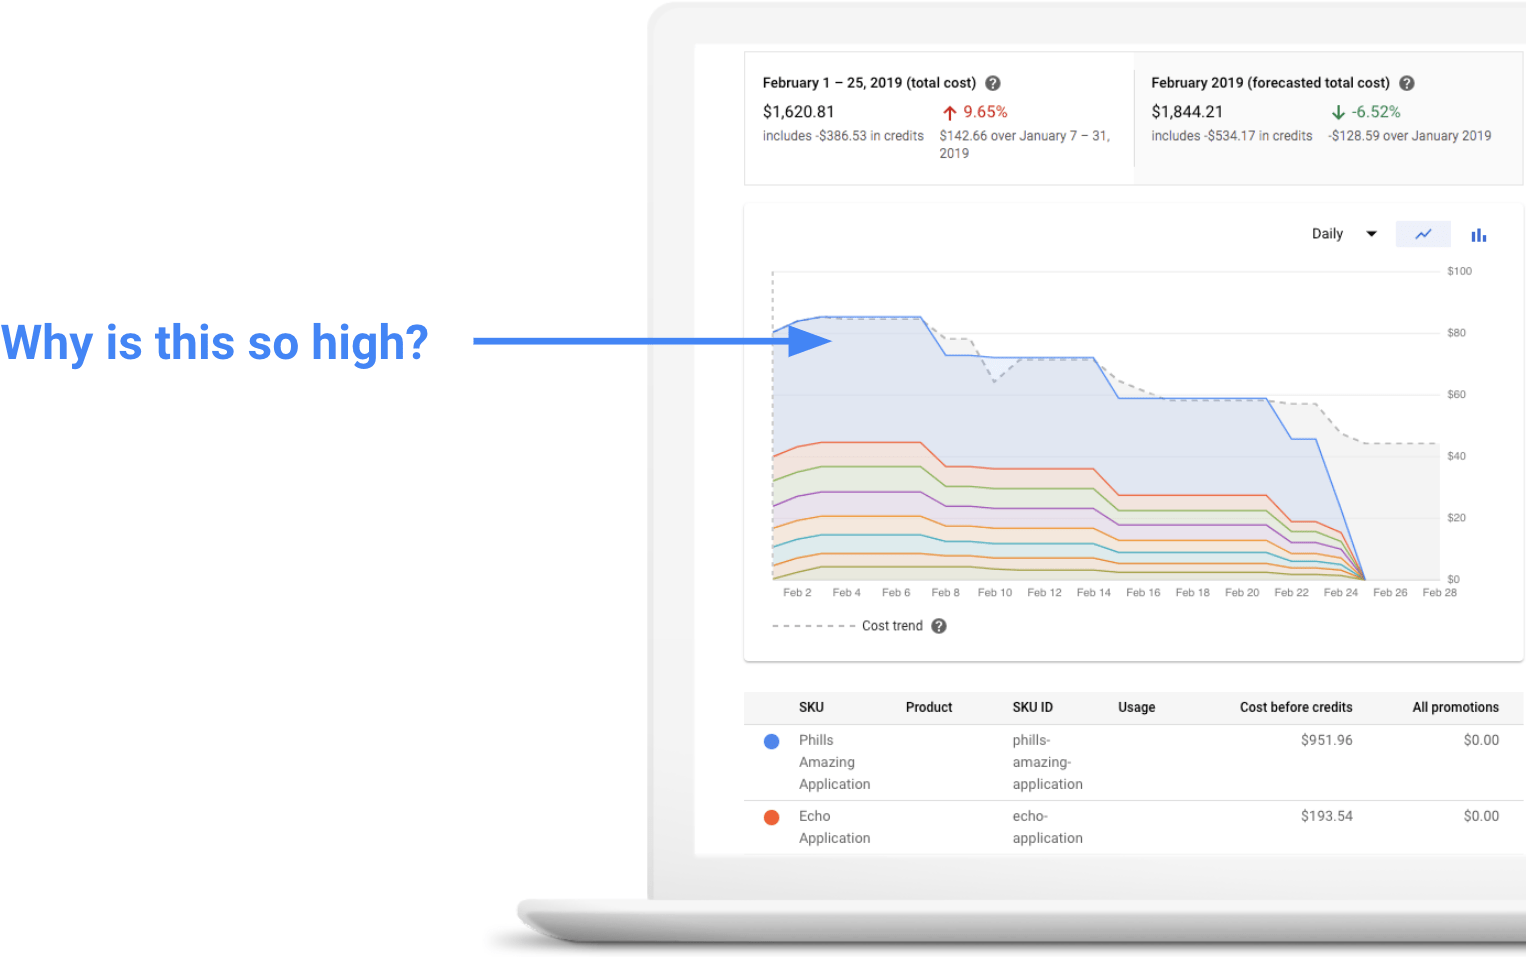
In order to manipulate the data, you need to put the raw billing data somewhere you can query and combine it with other data. The official, raw billing data is the most important data source, as it provides the truth about what you are being charged. Cloud vendors provide ways to get billing data in a structured form. In our case, we enabled Google’s billing export that appends records to a BigQuery table as they become available.
Once you have the raw billing data, you can ask detailed questions and create custom dashboards using data visualization tools (on Google Cloud, try Data Studio). While this is the same data your cloud vendor already provides in your bill, being able to run custom queries or save specific dashboards is sometimes enough to resolve cost mysteries. However, this does nothing to look inside the large line items. To do that, we need to add more detail.
Additional Usage Data
The first trick we use to breakdown large line items is to combine other usage data. Most cloud services provide detailed monitoring data, either in the form of logs or metrics. For example on Google Cloud, App Engine and Cloud Functions record logs for each request, and Pub/Sub exports metrics for bytes sent and received. The general plan is:
- Get finer-grained usage data into the database
- Compute percentage of usage for the additional breakdown dimensions
- Produce an annotated bill with these additional dimensions
For example, one of Bluecore’s large costs is App Engine CPU time. App Engine logs each request that it serves, so we examined the logs to see if there is some way we could convert that into cost. We discovered that if we sum the megacycles field in those logs, we get a very strong correlation with cost:
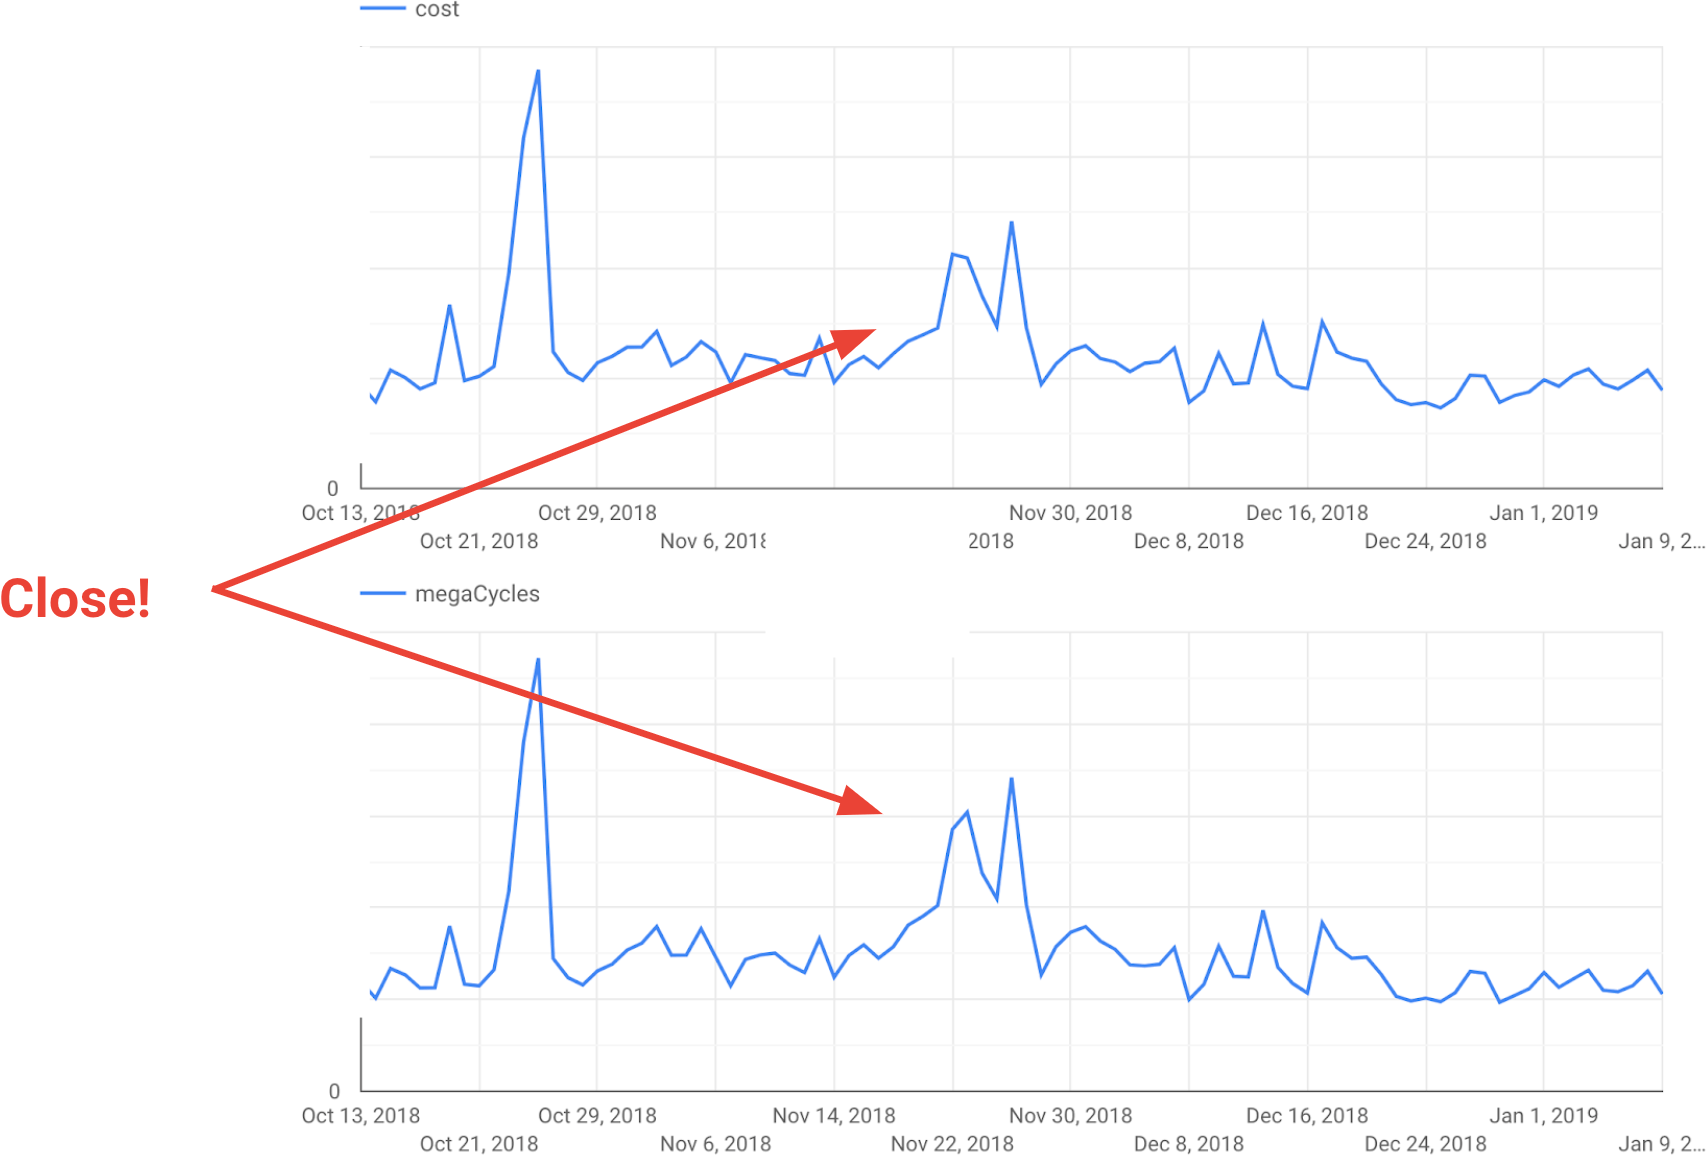
If you look carefully, you’ll notice this isn’t a perfect fit, but it is close. We did some additional validation to confirm this is good enough for our needs. So for App Engine, we can now do the following:
- Total the megacycles per day
- Compute cost of each request as (day cost) × megacycles / (total megacycles)
- Aggregate costs based on URL paths that make sense for Bluecore
We use a similar approach for other resources, such as Datastore Storage (from storage statistics) and Kubernetes Engine (using usage metering).
Instrumenting the Application
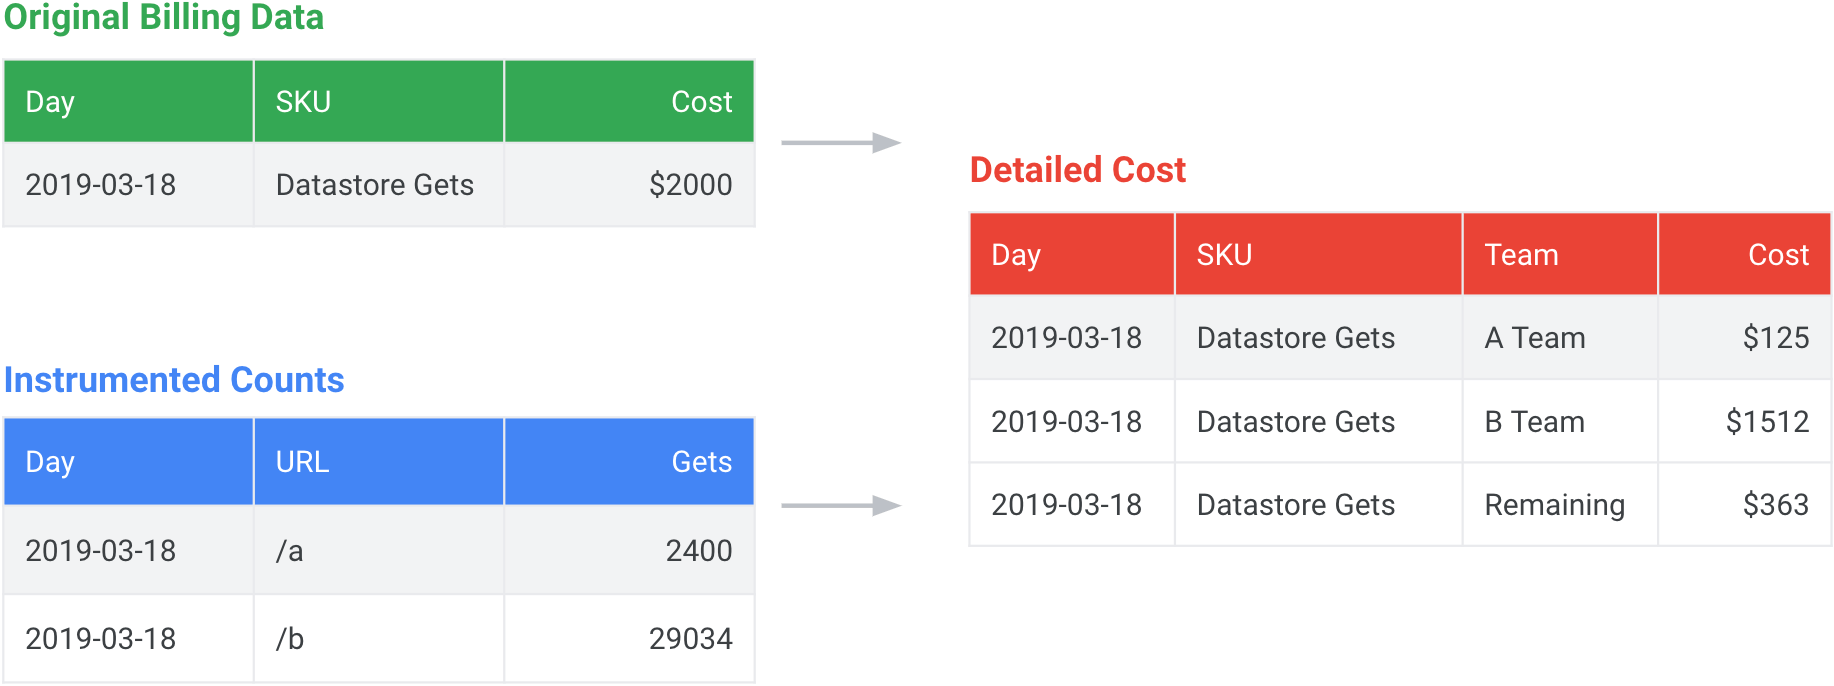
In some cases, there is no built-in data source that provides the level of detail we want. We have to instrument our application to report the data we need. As an example, we use Google Cloud Datastore, which charges for each read and write operation. We wanted to count the operations on a per customer and per feature basis. To do this, we modified our application to count the API calls it makes during each server request. We then log the counts in JSON format at the end of the request. Our logs are exported to BigQuery, so we can aggregate them into our final billing data table.
The process is shown in the figure below. We start with the original total daily cost from the billing data (in green in the top left), and our aggregated request counts (in blue in the bottom left). We combine this information to produce a detailed cost table with an additional team dimension. We don’t instrument all of our applications, so our total cost does not add up to the value from the bill. That’s okay! We put the rest in a remaining value to ensure our new table totals up to the original.
In conclusion, if your cloud bill doesn’t provide you exactly what you need, you can add the missing detail yourself. It does take a little bit of work, but you also don’t have to be 100% perfect. The result is being able to make better prioritization decisions. For example, it has helped Bluecore find team or customer specific performance bugs, where something is consuming far more resources than expected. Without these detailed metrics, they would have gone unnoticed.