[ 2020-April-12 11:31 ]
One of the most primitive but extremely useful tools for debugging is a stack trace: a list of all active functions and their callers (also called a traceback or backtrace). Since Go programs can easily have tens of thousands of goroutines, the output can be large, so you may need tools to work with them. This post lists all the ways I know to get stack traces, and brief notes on using go tool pprof with the binary format, or combining the text format using a hacky tool I wrote. After posting this, someone told me about panicparse, which is a much better tool for this purpose.
Getting stack traces in Go
- uncaught panic, SIGQUIT (CTRL-\): Go by will print a stack trace for the current goroutine if there is an uncaught panic. You can dump all stacks by setting the
GOTRACEBACK=allenvironment variable. If you send the SIGQUIT signal (type CTRL-\ on most terminals), the program will dump all stacks and exit. If the runtime crashes for some reason, such as running out of memory, Go will print all stacks. The SIGQUIT handler is particularly useful for debugging "stuck" programs without needing any preparation, since it is built-in to every Go program. - pprof HTTP
/debug/pprof/goroutinehandler: This pprof HTTP handler lists all goroutines. Add?debug=2to the URL to get the same text format as uncaught panics. You need to usego tool pprofto parse the binary format (the default or withdebug=0). I'm not sure what thedebug=1format is for. It is human-readable, but I preferdebug=2, since it is the same format I already read when my Go programs have bugs. - pprof.Profile.WriteTo: You can programatically trigger the pprof output with
pprof.Lookup("goroutine").WriteTo(f, 2). This is the same code as the pprof HTTP handler, so thedebugargument works the same way. See the pprof documentation for details.
If you want to play with these, see stackdemo.go, a program I wrote with command line flags to try all these approaches.
Combining stack traces
If you have a lot of stack traces, you are going to need some tools. If you have the binary format, there are two reports I like:
go tool pprof -http=localhost:8080 (file): Draws a graph view of the thread stacks, with counts for number of stacks that are the same. This view is a bit confusing at first, but is a very powerful visualization once you spend a bit of time understanding it. You can also pass
-svgto write the file directly to disk. If installing dot/Graphviz is annoying, use my hacky pprofweb tool. The image below shows part of the output, showing 100 goroutines with the a1/a2 call stack, and 50 goroutines with b1/b2: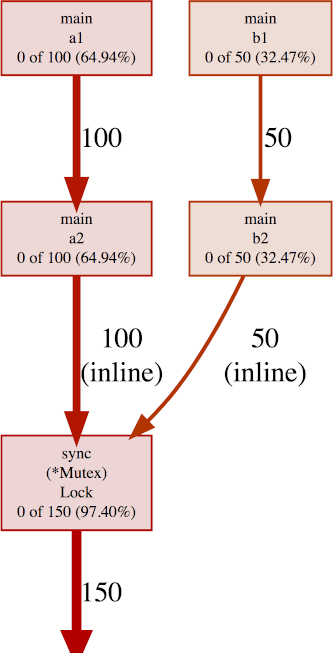
- go tool pprof -trace (file): This prints an aggregated list of stace traces sorted from most goroutines to fewest.
If you have the text format, you can use panicparse, which formats the output in a friendly format on your console. I made a hacky version of panicparse on the web. See the Github repository for the source.