[ 2004-July-09 10:37 ]
I'm currently doing research in the area of ad-hoc wireless networks using 802.11 hardware. I've just started ramping up with some simulations using ns-2. I was lucky to find Making NS-2 simulate an 802.11b link , a page with tips for getting ns2's output to match real hardware. This page presents some simple 802.11 simulations, and hopefully will eventually include some real measurements to back them up.
Maximum Throughput
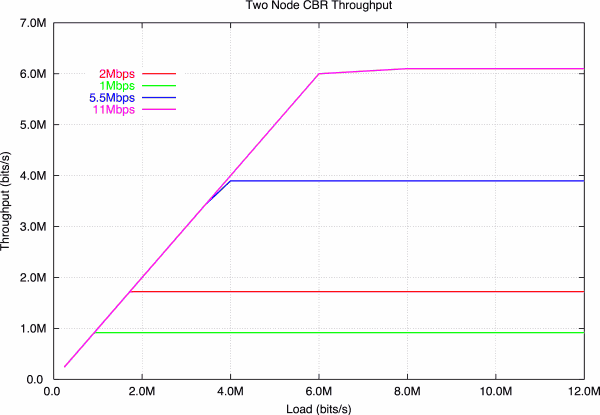
802.11b hardware supports 1, 2, 5.5, and 11 Mbps data rates. Real hardware automatically selects the rate based on errors. If there are many errors, it steps the rate down. If there have been no errors, it steps the rate up. The following graph shows the raw throughput that each of these data rates can actually deliver between two nodes, when sending data at a constant rate. This throughput is the network layer throughput, meaning the throughput if you strip out the MAC header, but include the IP headers.

As you can see, each data rate tops out at a little bit below the actual data rate. This difference becomes more pronounced as the data rate increases. At 1 Mbps, 802.11 delivers 91.7% of its data rate, while at 11 Mbps it delivers only 55.4%. However, this test was performed with the standard "long" preamble. Some modern cards can use a shorter preamble which is about half the length. This makes for a slight improvement (+ 483 kbps at 11 Mbps). I repeated this experiment with TCP Sack. The maximum data rates are listed in the table below. The TCP throughput is for the delivered bytes at the network layer. It includes the IP and TCP headers, but excludes retransmissions. As expected, TCP achieves a reasonable data rate, but still falls short of the optimal values.
| Data Rate | CBR Throughput (Mbps) | % Data Rate | TCP Throughput (Mbps) | % Data Rate |
|---|---|---|---|---|
| 1 Mbps | 0.917 | 91.7% | 0.790 | 79.0% |
| 2 Mbps | 1.722 | 86.1% | 1.442 | 72.1% |
| 5.5 Mbps | 3.897 | 70.9% | 3.014 | 54.8% |
| 11 Mbps | 6.099 | 55.5% | 4.276 | 38.9% |
| 11 Mbps (short preamble) | 6.582 | 59.8% | 4.903 | 44.6% |
Multihop Throughput
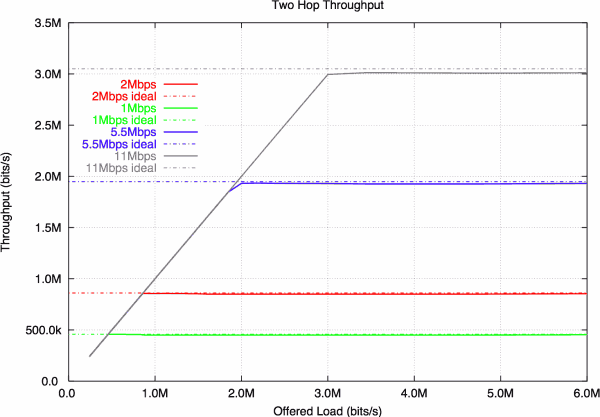
Things start to get more interesting when you relay data over multiple hops. When you go over two hops, the ideal throughput is halved, since the node in the middle must accept and retransmit the data. While it is doing so, the sender cannot transmit. The next simulation is the same as the first, except this time the data is being sent over two hops. The ideal values shown are the maximum throughputs obtained in the first experiment divided by two.

| Data Rate | Maximum Throughput (Mbps) | Ideal Throughput (Mbps) | % Difference |
|---|---|---|---|
| 1 Mbps | 0.457 | 0.459 | 0.327% |
| 2 Mbps | 0.857 | 0.861 | 0.494% |
| 5.5 Mbps | 1.934 | 1.949 | 0.734% |
| 11 Mbps | 3.013 | 3.050 | 1.195% |
What this data shows is that 802.11 does a very good job of scheduling packets in the two hop case. Even when trying to send much more data than the network can handle, it continues to deliver very close to the ideal throughput. The ns2 script I used to create these graphs is here.