[ 2013-June-29 14:31 ]
Last week, I tracked down a Java memory leak for the first time in years. I had to re-learn how to do it, so this is a note to my future self (and hopefully others). In this case, I found it using the JDK's debugging tools. While I know people who rave about some of the commercial tools, or Eclipse's Memory Analyzer (MAT), I've never tried them. The leaks I've dealt with have been obvious enough that the built-in tools got the job done. In fact, I find the JDK's tools (particularly jstack, jmap and hprof) to be useful enough that I know make sure all my production machines have the JDK installed, not just the JRE.
To track down a memory leak, you'll need a "heap dump" with a summary of the live objects in a leaky process. To record a dump, first run jps to find the process's PID, then run jmap -dump:live,format=b,file=(dumpfile) (pid). If you get the error "Unable to open socket file: target process not responding or HotSpot VM not loaded", it probably means the process is running as a different user. Add sudo -u (process user) in front of the command line, or run jmap as root with the -F flag. Finally, copy (dumpfile) to your local machine and run jvisualvm --openfile (dumpfile), or use jvisualvm's File → Load menu. Once it loads (which is slow), click the Classes tab to see something like the following:
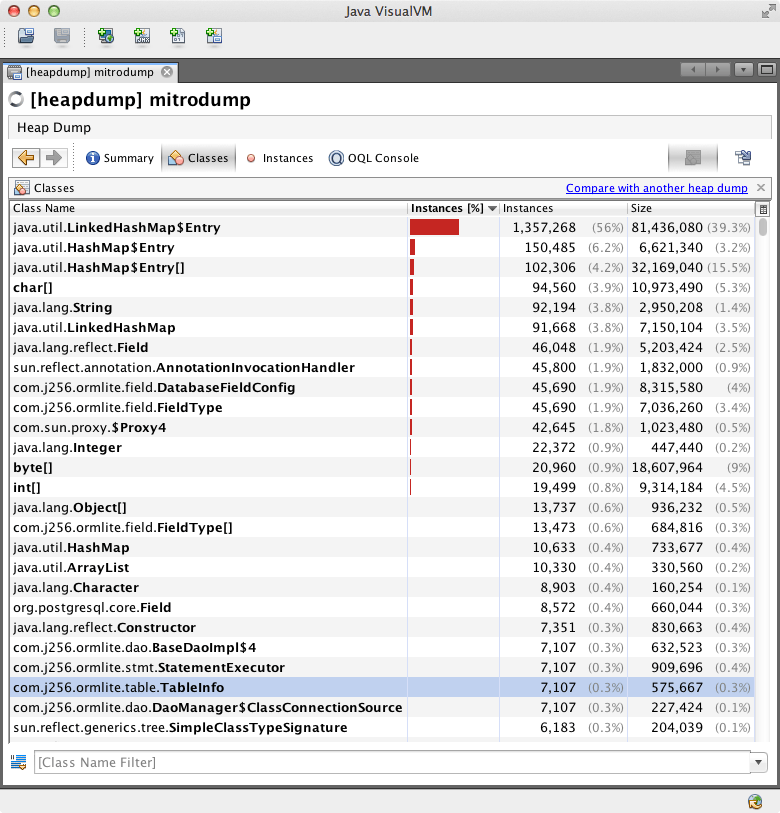
This groups objects by class, ordered them from most to least number of instances. If you have a long running leak, it is probably one of the classes near the top of this list. Sadly, this is the point where you need use everything you know about the application and the internals of the objects. You need to look for "suspicious" classes: those that have "too many" instances, or are occupying too much memory. JVisualVM lets you step through all the references to any object, so it gives you the raw tools you need to find the leak, but sometimes it is confusing to understand. As an example, I'll briefly explain how I found this leak:
In this case, we have millions of LinkedHashMap.Entry objects, which must be part of some LinkedHashMap. Tracing through some random instances didn't immediately reveal anything suspicious, so instead I resorted by size. HashMap.Entry[] (arrays of HashMap.Entry objects) jumped to second place, occupying 32 MB of memory, or 15% of the heap. This seemed promising: for it to jump up so much means there must be some particularly large arrays. Drilling into that class, ordered by size, revealed the following:
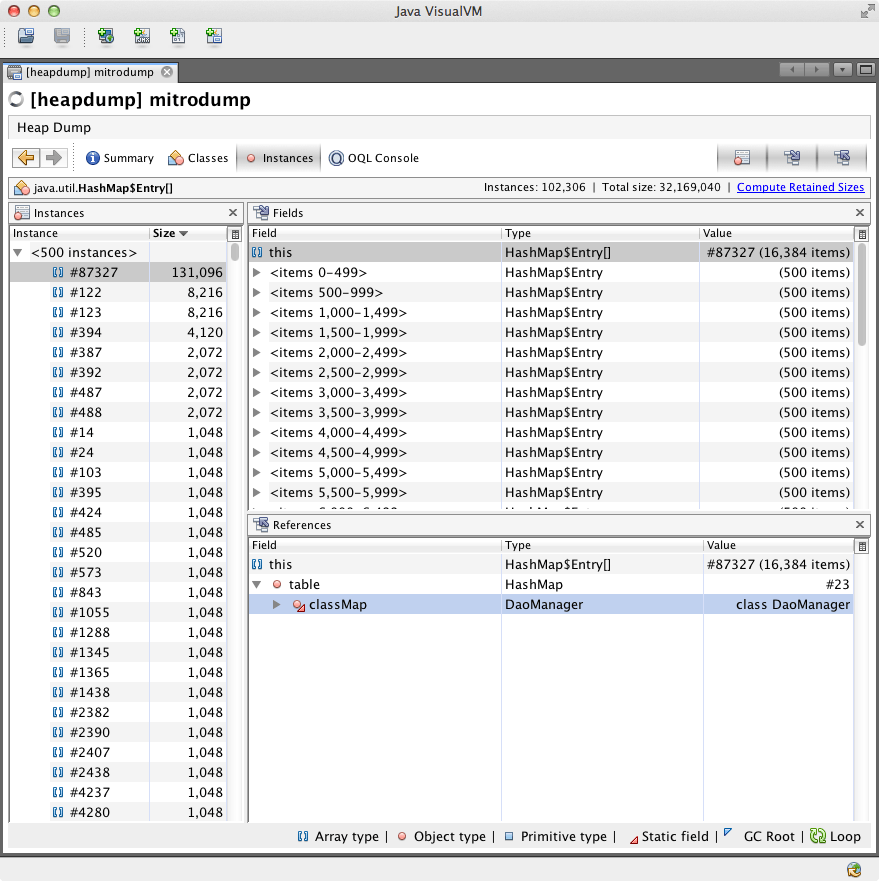
The left hand pane shows all instances, with largest first. The top entry (selected) is an array of 131 096 elements! The top right pane shows the object's fields, with this (the object itself) selected. The bottom right pane shows all references to the array. This shows that it is referred to by a field called HashMap.table, which is part of the HashMap object containing the array. In turn, this is referred to by a static field DaoManager.classMap (part of OrmLite). This is the smoking gun: looking at the source of DaoManager quickly showed that this static field is a cache. In our case, it holds references to a huge number of database connection objects. Despite closing the connections, these objects were not removed from the cache. Adding a call to DaoManager.unregisterDao solved the problem.
I would argue that OrmLite's default caching behaviour is very stupid, and this cache should at least use weak references, allowing the objects to eventually be garbage collected. On the other hand, we aren't really using OrmLite te the way it was designed to be used. This is a debate for another post, since our quick-and-dirty fix solved our problem.