[ 2015-May-26 09:39 ]
My team at Twitter accidentally built a system that detects exciting sporting events: we got paged on three separate occasions because one of our services went down in one data center. Needless to say, we wanted to un-build this system as quickly as possible. The first time I got paged during the Seattle Seahawks NFL playoff game, when it was tied in the last minute. I think the other pages were due to NCAA basketball and the cricket world cup. These events caused a lot of users to tweet at the same time, sending a large spike of traffic. Our service ended up using a few gigabytes of extra memory and got killed by the Linux kernel. After one instance was killed, the load increased on the remaining instances, eventually taking them all down. As a JVM service, the "extra" memory must be native memory, and not just normal Java object allocations, but our service wasn't doing anything special with native memory. We finally found the underlying Java native memory leak a few weeks ago. TL;DR: Always close GZIPInputStream and GZIPOutputStream since they use native memory via zlib. To track down leaks, use jemalloc and turn on sampling profiling using the MALLOC_CONF environment variable. [Update: Someone used these instructions and found the same issue: not closing a ZipInputStream. However, I disagree with their conclusion (see my comment on the post).]
Similar to the JVM mmap garbage collection pauses I wrote about previously, a lot of people spent a bunch of time debugging this, over the course of multiple months. Each time we got paged, we put additional workarounds in place to make it more difficult to trigger in the future. We also spent more time trying to find the "real" bug, without much success. This particular problem was easy to reproduce: just send many concurrent requests to a test instance. Unfortunately, slowing the instance down (e.g. by using strace) would make the problem go away. Since it appeared that our mitigations were working, we moved on to higher priority issues.
A few weeks ago, someone reported a problem that seemed similar to ours. Kirandeep Paul suggested using jemalloc's built-in allocation profiling, that traces what is calling malloc. This is relatively low cost since it only samples a fraction of the calls to malloc. It is also easy to try, since it can be turned by setting the MALLOC_CONF environment variable, without any code changes. This did the trick. I set MALLOC_CONF=prof:true,lg_prof_interval:30,lg_prof_sample:17, which writes a profile to disk after every 1 GB of allocations, and records a stack trace every 128 kB. This file can be converted to a graph using jeprof (part of jemalloc). This created the following graph for our service.
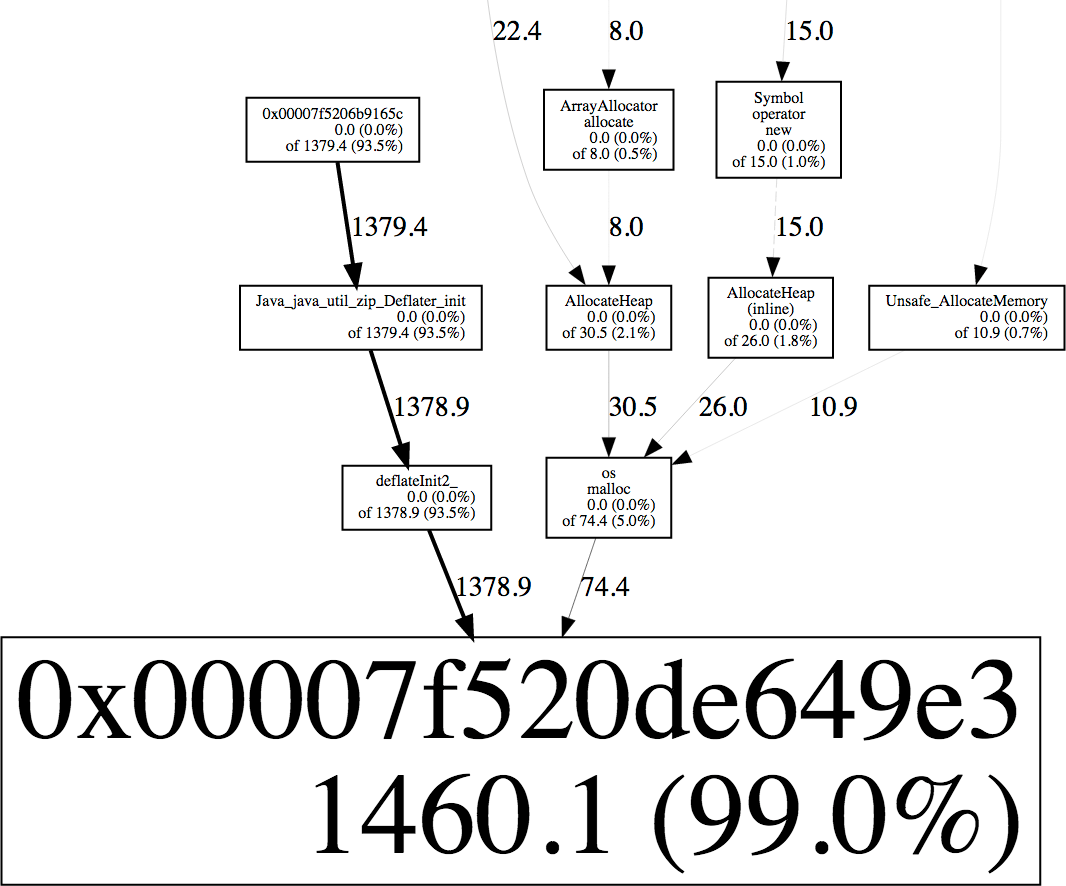
This shows that 94% of the "live" blocks were allocated by Java_java_util_zip_Deflater_init and deflatInit2 (part of zlib), while only 4% are from os::malloc and therefore the JVM itself. I found it surprising that this program was compressing anything, so I mentioned it to Carsten Varming (Twitter NYC's local JVM expert). He had seen Deflater cause memory problems at Twitter before. It uses the native zlib library, which allocates a small buffer using malloc. If it isn't closed, the memory isn't freed until the finalizer runs, which would explain the symptoms. We used Linux perf to find the code that was compressing stuff. At Twitter, we configure the JVM and perf to generate stack traces across both native and Java code, so I ran perf record -g -p (PID) to record stack traces while generating overload (you can do this using perf-map-agent). I then used perf report to search for stacks referencing Deflater, which quickly showed the culprit: an exception logger that was compressing messages without closing the GZIPOutputStream. This explained why it only happened during overload: the memory usage would only increase if a lot of exceptions happenend between garbage collections, and eventually the finalizers would run to clean up the native allocations. Adding a try/finally block to close the stream fixed the problem, and stabilized our service's memory usage under load.
I spent a few hours auditing all the uses of GZIP streams at Twitter, and found a handful of places that forgot to close the stream. I don't think any of them would have caused a similar memory leak, but I fixed them anyway to avoid future copy-and-paste bugs. (I also found one in Apache Spark.) I think FindBugs would have reported warnings for these issues, which shows the potential value of static analysis, particularly for "known dangerous" cases like this. I would love to have a pre-commit checker block people from commiting future uses that don't have a call to close().